
KPI Studio
KPI Studio lets creators transform numbers into polished video-ready animations in seconds
KPI Studio is an innovative tool designed for creators, enabling them to effortlessly turn raw data into visually appealing animated charts. In just seconds, users can transform complex numbers into polished, video-ready animations, making data presentation engaging and impactful.
Video creators, educators, and marketers who need to create animated charts quickly without motion graphics expertise.
KPI Studio is a web-based tool that lets users effortlessly convert raw data into animated charts, ready for video integration in formats like MP4 and GIF. It offers a quick, no-experience-required solution for creating professional animations tailored for video content creators.
KPI Studio
Sunday, May 10, 2026
14 / 100
Ahrefs Domain Rating measures backlink strength on a 0 to 100 scale.
- Supports multiple chart types including bar, line, and pie charts
- Real-time previews for instant adjustments
- Exports in MP4, GIF, or transparent video formats
- Customizable themes, colors, and styles
- User-friendly interface for quick and easy animation creation
- Exports animations in multiple formats including MP4, GIF, and transparent MOV/WebM for easy integration into video editing software.
- Supports a variety of chart types and customization options to fit different data storytelling needs.
- No software installation required as it runs entirely in the browser.
- The free tier limits export options, requiring a subscription for full capabilities.
- Focused exclusively on animated charts, not suitable for other types of motion graphics or video effects.
Getting started with KPI Studio is a breeze! First, sign up for an account and log in to the platform. Next, import your raw data by either uploading a file or using an API integration. Choose from a variety of templates and customization options to fit your brand’s style. After that, simply select the type of chart you want to create and let KPI Studio do the magic! Once you're satisfied with your animated chart, export it in your desired video format and share it across your platforms. It’s that simple—bringing your data to life has never been easier!
KPI Studio is a game-changer for data-driven video creators and startup founders alike. It addresses a common pain point: the time-consuming process of creating motion graphics for data visualization. With KPI Studio, you can produce stunning animated charts in mere seconds, allowing you to focus on storytelling rather than getting lost in design intricacies. This tool not only saves time but enhances the quality of presentations, making your data compelling and accessible. For founders looking to communicate their metrics effectively, KPI Studio is an invaluable asset that elevates your content and captures your audience's attention.
Real performance numbers in the last 30 days
Questions
Is KPI Studio free to use?
Yes, KPI Studio offers a free tier that includes animated chart exports, while a Pro subscription unlocks additional features such as unlimited exports and higher frame rates.
What chart types does KPI Studio support?
KPI Studio supports ten animation templates, including count-up numbers, bar charts, line charts, odometer animations, pie charts, and more.
How do I export an animation from KPI Studio?
To export an animation, enter your data, select your chart type and style, then click the export button to choose your desired video format.
Related Productivity
View all Cambodia TemplesCambodia Temples
 Southern Maryland Minority ChamberBuilding a culture of entrepreneurship in southern Maryland
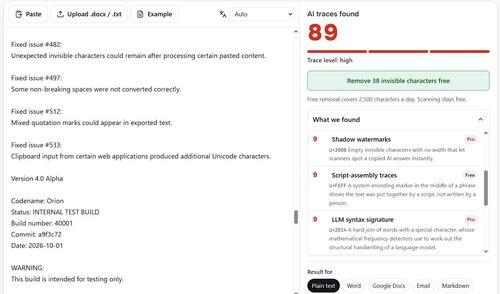 Remove AI TracesFind and remove every hidden AI trace in your text.
 KeebyeKeebye — Voice Dictation for Parallel Builders
 PavleurPavleur — Your AI Copilot for Every Meeting
 GeekBye - AI Interview AssistantGeekBye - Real-Time AI for Interviews