Fusedash
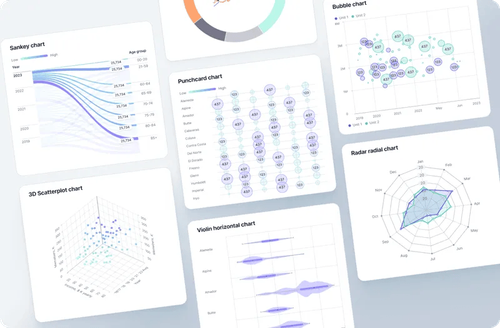
Dashboards, charts, maps, and data chat from one dataset.
AI data visualization platform for dashboards, charts, maps, and data chat. Build KPI views from one dataset and generate summaries with AI.
•What is Fusedash?
Fusedash is an AI-driven data visualization platform that allows users to create dashboards, charts, maps, and reports in a single workspace. It turns raw data into insightful visuals that teams can easily understand and act upon.
•How to use it
Start by connecting your data through CSV uploads or APIs, then define your key performance indicators (KPIs). Use Fusedash's flexible tools to create customized dashboards, charts, and reports tailored to your audience's needs.
•Background
Fusedash simplifies the data visualization process by allowing teams to work from a single dataset, ensuring consistency across different reports and dashboards. The platform combines various data sources and offers smart chat functionalities to enhance exploration and insight generation. With Fusedash, teams can focus on actionable insights rather than rebuilding reports.
Frequently Asked Questions
What types of data sources can I connect to Fusedash?
Fusedash allows users to connect various data sources including CSV files, APIs, and public data to create comprehensive visualizations.
Can I customize the dashboards for different teams?
Yes, Fusedash enables users to customize layouts, filters, and views to cater to the specific needs of different teams and stakeholders.
Is there support for real-time data monitoring?
Absolutely! Fusedash offers a Real-Time Interface feature that allows you to monitor live data and make timely decisions based on the most current insights.
More Featured Startups
View All →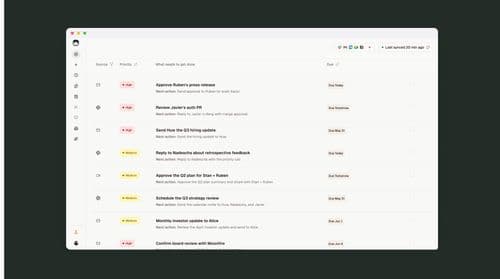
readywhen
AiIt learns your business, catches every commitment and decision, and moves the right work forward.
.png&w=3840&q=75)
WritersLock
ProductivityWritersLock is a journaling app that blocks distracting apps until you've written. Open TikTok before you've journaled and you'll hit the lock screen. Write your entry for the apps unlock. It's built for people who want to write every day but keep losing the morning to scrolling. Instead of relying on willpower, WritersLock puts a barrier between you and the scroll. Writing never leaves your device. No account required.

Seedance 2.5 API
AiSeedance25API.io is an independent website for developers preparing to use the Seedance 2.5 API. It provides API availability updates, expected specifications, real video examples, reusable prompts, request-building tools, quickstart guides, and integration resources.

SocQ
BusinessSocial Media Scraping API
Related Products
.png)

Featured Banner for Fusedash Productivity Tool (1080x75)
